

In short
- Divide a defined interaction count by your chosen denominator and multiply by 100.
- Follower, reach, impression, and view formulas answer different questions.
- An average of post rates can differ from a ratio of summed actions to summed exposure.
In this article
Engagement rate is the share of interactions a post receives relative to its audience or exposure. To calculate it, divide the interactions you want to measure by followers, reach, impressions, or views, then multiply by 100. Name both parts of the formula because changing either changes the result. Calculate each post separately before choosing how to summarize several posts.1
To run these formulas on your own numbers, use the free engagement rate calculator.
Decide what counts as an engagement
Start with the question you want the number to answer. You might measure public reactions and comments to compare visible responses, or include private analytics such as saves and shares when evaluating your own content. Write down the actions included before comparing posts.
For example, LinkedIn Page analytics defines engagement rate using clicks, reactions, comments, and shares relative to impressions. A hand calculation using only reactions and comments will not reproduce that native rate.2
Do not silently replace a missing action count with zero. If you cannot obtain saves for a comparison account, either compare the actions available for both accounts or label the comparison as incomplete. Likewise, separate organic and paid results when your question is about unpaid content.
The numbers in the worked examples below are made up to show the arithmetic. They are not typical results.
The main engagement rate formulas
The general calculation is interactions divided by the chosen denominator, multiplied by 100. Hootsuite documents follower-based, reach-based, impression-based, and view-based versions.1
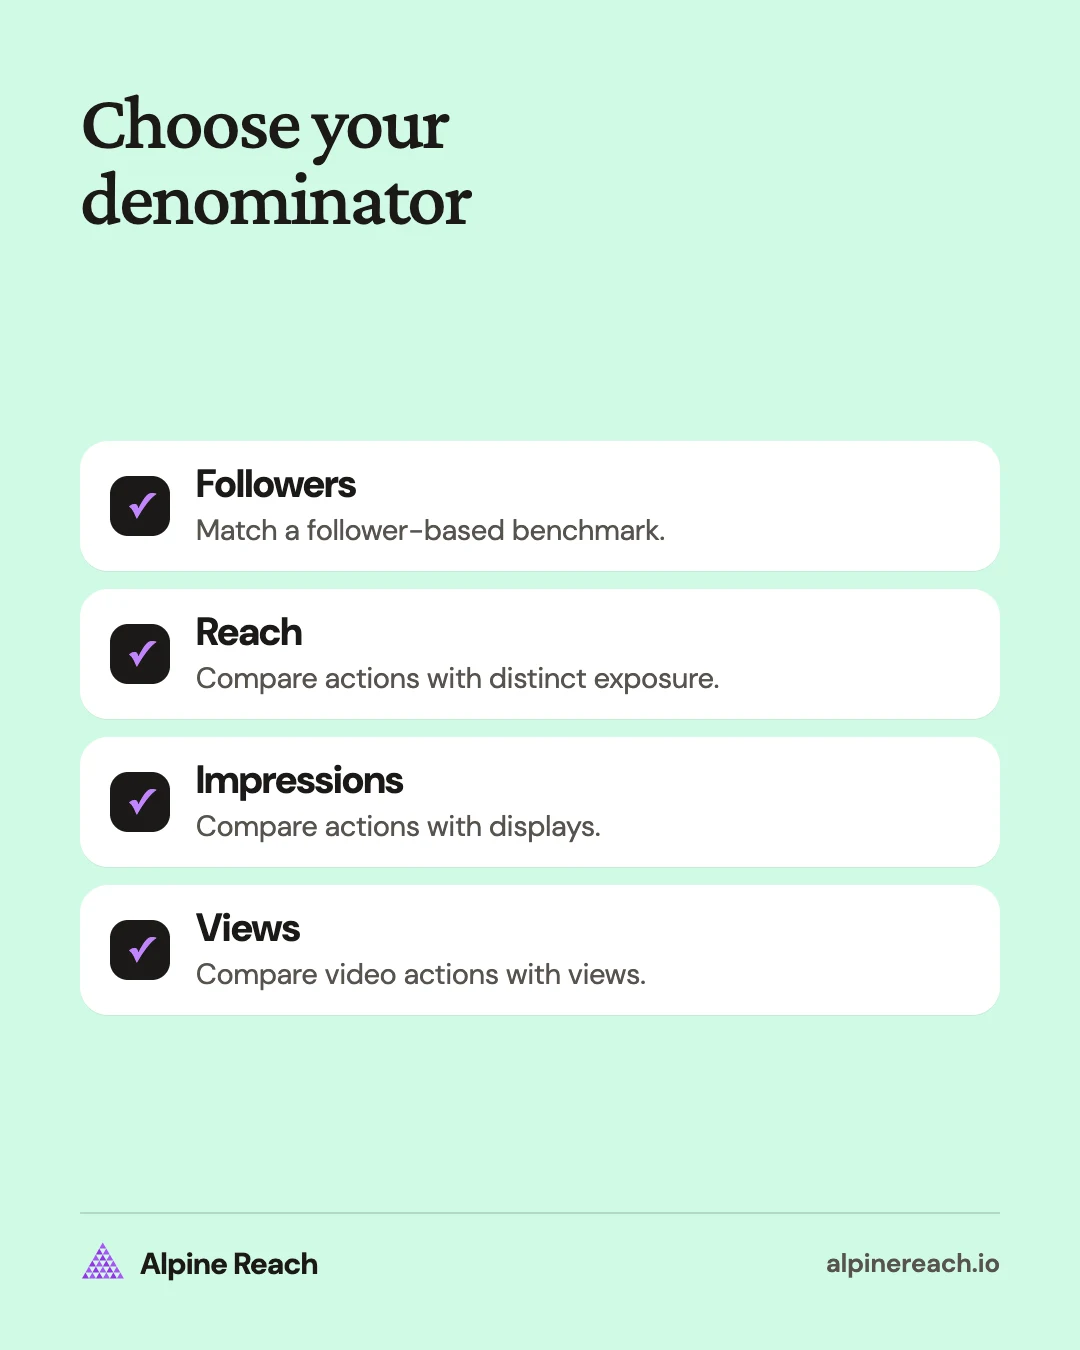
Use one example post to see why the denominator matters. It receives 70 likes, 10 comments, 15 saves, and 5 shares: 100 interactions in total. The account has 5,000 followers; the post reaches 2,000 accounts and records 4,000 displays or views. Applying the cited formulas produces the results below.1
| Formula | Calculation | Result | What it compares |
|---|---|---|---|
| By followers | 100 / 5,000 × 100 | 2% | Actions relative to audience size |
| By reach | 100 / 2,000 × 100 | 5% | Actions relative to distinct accounts reached |
| By impressions | 100 / 4,000 × 100 | 2.5% | Actions relative to displays |
| By views | 100 / 4,000 × 100 | 2.5% | Actions relative to recorded views |
The equal impression-based and view-based results are a feature of this example. They do not mean impressions and views are interchangeable in a platform's reporting.
Engagement rate by followers
Use post interactions / follower count × 100 when your benchmark uses followers. Record when you captured follower count. If the audience grew substantially during a campaign, dividing every old post by today's follower count changes the basis of comparison.
This rate does not tell you what percentage of followers interacted. Non-followers may interact, and an individual may take more than one action. Treat it as an action-to-audience ratio.
Engagement rate by reach
Use post interactions / post reach × 100 to evaluate response relative to the distinct audience exposed to that post. It is useful for your own content when you have reach data. Keep total interactions and reach beside the rate, especially when a small audience produces a large percentage.
Engagement rate by impressions or views
Use post interactions / impressions × 100 for a display-based report and video interactions / video views × 100 for a view-based report. Match the denominator to the analytics you actually have, rather than renaming views as reach. On Instagram, Views is defined as the number of times your content was played or displayed, so that is the display count to use there.3
For a video, record the platform, view metric, video length, and capture date. This prevents a later comparison from treating differently defined view counts as the same input.
Cost per engagement
For paid posts, cost per engagement divides the total amount spent by total engagements. For example, a $200 spend that earns 800 engagements costs $0.25 per engagement.1
How to average engagement rate across posts
There are two useful summaries: the average of post rates and the ratio of summed actions to summed denominators. They answer different questions. Choose one, label it, and use it consistently.
Here is a reach-based example using the same general formula.1
| Post | Interactions | Reach | Rate by reach |
|---|---|---|---|
| A | 20 | 200 | 10% |
| B | 80 | 2,000 | 4% |
Average post rate: add the two percentages and divide by the number of posts. In this example, (10% + 4%) / 2 = 7%. Each post receives equal weight, so the smaller post has the same influence as the larger one.
Combined action-to-reach ratio: add interactions, add each post's reach, then divide those totals. Here, (20 + 80) / (200 + 2,000) × 100 = 4.55%, rounded to two decimal places. This weights each post by its reach.
Both calculations are correct. Report the average when your question concerns the typical post's rate. Use the ratio of totals when your question concerns actions relative to all recorded post-level exposure. Neither is a deduplicated monthly audience rate: an account reached by both posts appears in both denominators.
A median is another useful description of a typical post. Sort post rates and take the middle value, or average the middle pair for an even-sized list. Keep that label separate from “average.” Buffer's research uses medians as its default because unusually large results can pull means away from typical performance.4
How to calculate engagement rate in a spreadsheet
Create columns for post link, publication date, format, capture date, interactions, and your chosen denominator. Add separate action columns if you need to audit what went into the numerator.
If interactions are in B2 and reach is in C2, enter =B2/C2 and format the result as a percentage. If you instead enter =(B2/C2)*100, keep the result as a plain number and label the column “percent.” Applying percentage formatting to that second version multiplies the displayed result again.
For a post with 100 interactions and 2,000 reach, the underlying fraction is 0.05. Percentage formatting displays 5%. These are two representations of the same value.
For a list of posts:
- Use
=AVERAGE(D2:D11)when D contains individual fractional rates. - Use
=SUM(B2:B11)/SUM(C2:C11)for the ratio of total actions to total post-level reach. - Use
=MEDIAN(D2:D11)for the middle post rate. - Keep unavailable or zero-denominator rows out of the calculation and flag them for review.
A zero denominator makes a rate undefined. Do not show it as 0%, and do not let an error-handling formula turn missing analytics into apparent underperformance.
Which formula should you use on each platform?
Choose the formula required by your report or benchmark, then check the platform's actual inputs. The platform name alone does not determine a universal calculation.
For Instagram, a reach-based review of your own posts and a follower-based industry benchmark can both be useful. They should occupy separately labeled columns. The Instagram benchmark guide explains why published rates can differ so much.
Whether a rate like 0.5% is good depends on its denominator. Rival IQ's 2026 report puts the median brand Instagram account at 0.30% of followers per post, while Buffer's reach-based 2025 Instagram median is about 5.4%.54
For LinkedIn Pages, preserve the native impression-based rate when reporting it. Personal-profile reporting needs its own definition rather than automatically borrowing the Page formula. Use the LinkedIn analytics walkthrough to identify the report you are reading.
For Facebook, count reactions, comments, shares, and link or button clicks if your report includes clicks, and name that choice in the label.1
For TikTok or YouTube, a manual view-based calculation can answer “how many actions occurred relative to recorded views?” Treat that as your defined reporting metric. Do not present it as a native platform rate unless its documented calculation matches yours.
If you are borrowing a study's benchmark, copy its numerator and denominator first. Buffer's 2026 report, for example, uses reach-based engagement where available and notes that components and substitute denominators can differ by platform.4
Before you send a result, check that it includes the account, date window, actions counted, denominator, and averaging method. Then read it with the other social media metrics tied to your goal. A calculation is useful when someone else can reproduce it and understand what it measures.
FAQ
Does a 5% engagement rate mean 5% of people interacted?
Only if your numerator and denominator both count distinct people or accounts on a matching basis. A numerator made of actions can include several actions by one person.
What should I do when reach is zero or missing?
Mark the rate unavailable and check the analytics. A zero denominator makes the calculation undefined; a missing number should not become a measured zero.
Why does my manual rate differ from the dashboard?
Check the actions included, the denominator, the reporting period, and the averaging method. The dashboard may use a different definition from your spreadsheet.
General information. Platform features, limits and benchmarks change: check the cited page before you rely on a number.
References
- Hootsuite. How to calculate engagement rate in 2026. 2026. View source (accessed Nov 10, 2026).
- LinkedIn. Content analytics for your LinkedIn Page. n.d. View source (accessed Nov 10, 2026).
- Instagram. Definitions of Instagram insights metrics. n.d. View source (accessed Nov 10, 2026).
- Buffer. The State of Social Media Engagement in 2026: 52M+ Posts Analyzed. 2026. View source (accessed Nov 10, 2026).
- Quid (Rival IQ). 2026 Social Media Industry Benchmark Report. 2026. View source (accessed Nov 10, 2026).