

In short
- Match each metric to a question about visibility, response, or the next action.
- Keep reach, displays, interactions, and unique engaged accounts separate.
- Name the engagement rate formula and preserve each platform's metric labels.
In this article
Social media metrics are the numbers a platform records about your account and content, such as reach, views, interactions, follows, and clicks. The social media metrics that matter are the ones that answer your current question: who saw your content, how they responded, and whether they took the next step. Start with reach or views, interactions, an explicitly labeled engagement rate, and a goal metric such as follows or link visits. Keep the platform, date range, and calculation beside every number.
Which metric answers which question?
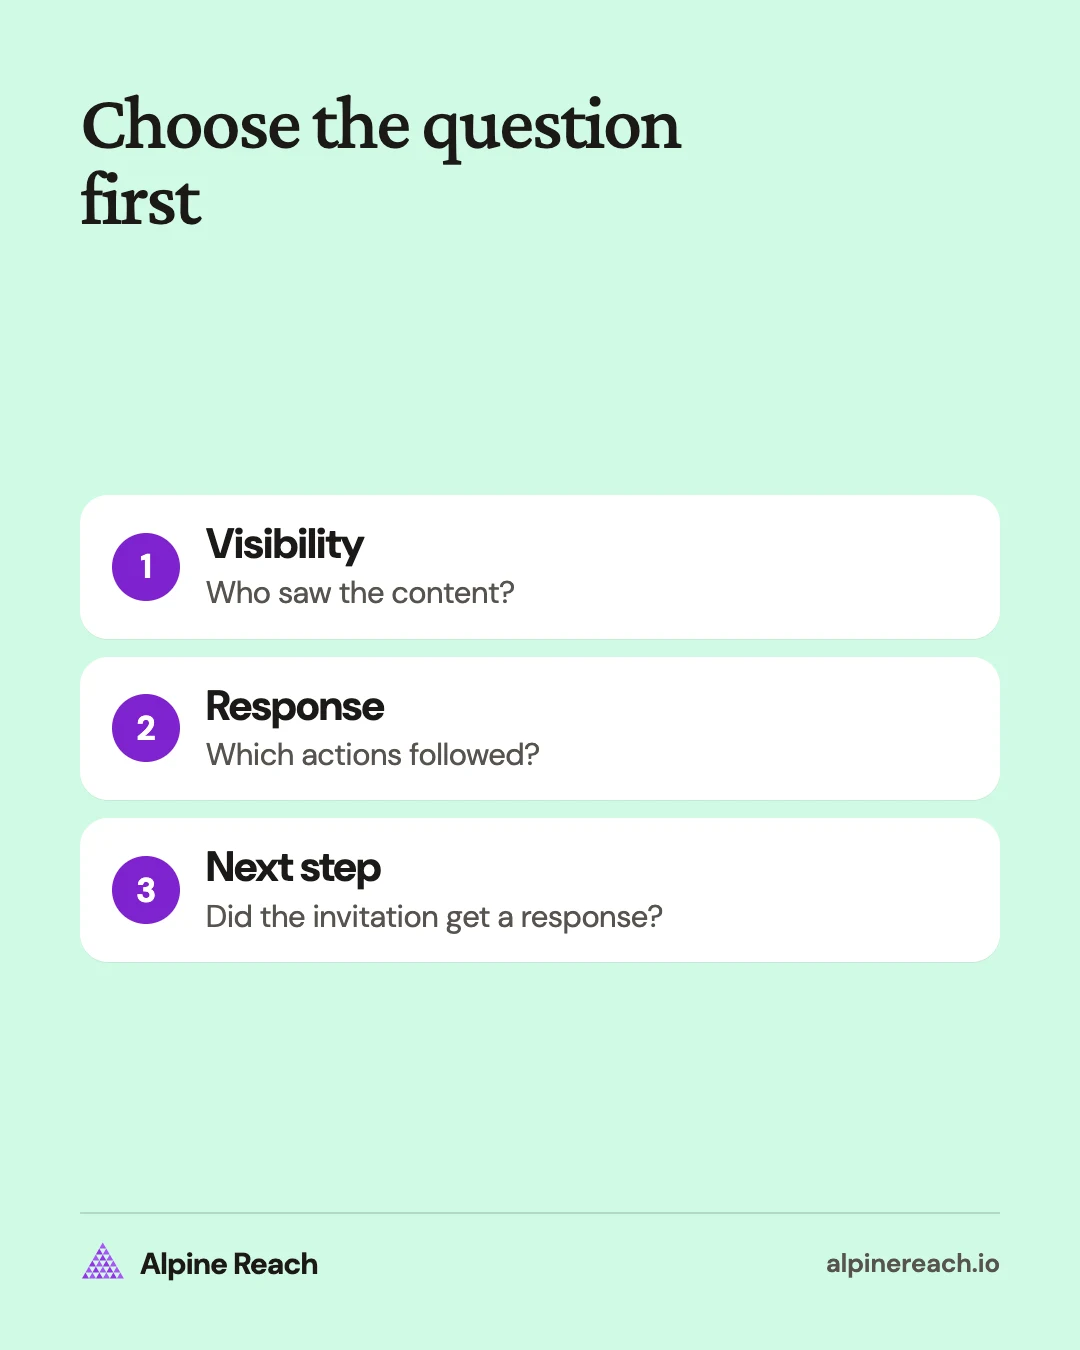
Choose a goal before opening a dashboard. Use visibility metrics to evaluate distribution, interaction metrics to evaluate response, and profile or website actions to evaluate the next step you asked people to take.
For example, a freelance designer might publish an educational carousel to earn saves, a portfolio post to prompt profile visits, and a service announcement to attract inquiries. Ranking all three by likes alone would ignore their different jobs.
Use this decision table as a reporting convention:
| Your question | Start with | Read alongside it | Decision it can inform |
|---|---|---|---|
| Did the content get seen? | Reach, viewers, or impressions | Format and publishing volume | Which distribution approach to test |
| Did people respond? | Interactions and engagement rate | Reach and the actions included | Which topic deserves another attempt |
| Was it useful enough to keep? | Saves | Post topic and format | Which explanation to expand |
| Did people pass it along? | Shares or sends | Audience reached | Which idea to adapt |
| Did attention lead somewhere? | Profile visits, follows, or link visits | The post's stated next step | Whether the invitation was clear |
| Did people keep watching? | Watch time and average watch time | Video length and views | Which opening or explanation to revise |
These are questions to investigate. A save does not tell you why someone saved a post, and a profile visit does not establish that someone intends to buy.
What the main social media metrics mean
Reach counts distinct accounts or people exposed to content, under the platform's definition. Impressions count displays, so repeated displays can increase impressions without increasing reach. LinkedIn calls its distinct-audience measure members reached and excludes repeat displays from that count.1
On Instagram, the current help page defines views as content plays or displays and viewers as unique accounts that saw content on screen. Interactions include actions such as likes, comments, saves, and shares; accounts engaged counts distinct accounts that interacted. Instagram also describes follower growth as followers gained or lost.2
For your report, keep the actions separate when possible:
- Likes or reactions: a recorded response to a post.
- Comments: written responses, which you can also read for recurring questions.
- Saves: use the platform's save count to compare material people kept.
- Shares, reposts, or sends: record the exact label because these may refer to different actions.
- Follows: distinguish new follows, unfollows, and the total audience at the end of the period. Follower growth rate is net new followers divided by followers at the start of the period, multiplied by 100.
- Profile visits: distinguish visits to your profile from views of your posts.
- Clicks: record the destination or object clicked, rather than assuming all clicks lead to your website.
That last distinction matters on LinkedIn Pages: its clicks metric can include clicks on content, the company name, or its logo. Page engagement rate includes clicks, reactions, comments, and shares divided by impressions.1 LinkedIn also reports click-through rate (CTR): the clicks a post received divided by its impressions.1
Watch time is time spent watching. Instagram's Reel watch time includes replays, while its average watch time divides watch time by initial views. YouTube reports watch time in hours and defines its own average view duration. Keep those labels and units intact when recording video results.34 YouTube counts a view the moment a video starts to play across all formats, beginning August 24, 2026, so compare months before and after that date with care.4
How to calculate and label engagement rate
Engagement rate compares a set of actions with a denominator such as followers, reach, impressions, or views. These are different calculations, even when a tool calls each one engagement rate.5
As an example, suppose a post has 60 interactions, reaches 1,500 accounts, and belongs to an account with 3,000 followers. Its rate by reach is 60 divided by 1,500, multiplied by 100, or 4%. Its rate by followers is 2%. The post did not change; the denominator did. These are illustrative calculations using the cited formulas, not benchmark results.5
Write a label such as “post interactions divided by post reach” in the report. Also list which interactions you included. Follow the engagement rate formula guide for per-post calculations, averages, and spreadsheet examples.
Avoid a universal target for every account. When you want outside context, use the Instagram engagement benchmark comparison and match its formula before comparing your result.
Where to find your platform's numbers
The paths below reflect public platform documentation checked on November 10, 2026. Use the app's own metric definitions if a label differs in your account.
| Platform | Where to look | Useful starting point |
|---|---|---|
| Instagram (public accounts) | Profile, then Professional dashboard (personal accounts: Your dashboard); on instagram.com, Dashboard in the left menu | Views, interactions, new followers, and content shared |
| LinkedIn personal profile | Profile, Analytics, Show all, then Content analytics | Post performance and audience growth |
| LinkedIn Page | Page admin view, Analytics, Content | Impressions, members reached, clicks, and engagement rate |
| TikTok | TikTok Studio, Analytics | Account overview, content, viewers, followers, and video analytics |
| YouTube | YouTube Studio, Analytics, Content | Views, thumbnail impressions, watch time, and average view duration |
Instagram documents the dashboard paths and public-account access.6 LinkedIn documents personal analytics navigation and the separate Page content report (Page admin view, then Analytics, then Content).71 TikTok lists account and video analytics within TikTok Studio.8 YouTube documents its Content tab and metric definitions.4
For a single Instagram post or Reel, use the content's own insights rather than treating the account overview as its result. The Instagram Insights walkthrough explains those screens. For profile, Page, and export differences, use the LinkedIn analytics guide.
A simple monthly social media report template
Copy this table once per account. Use matching date ranges, separate organic from paid activity, and leave unavailable cells as “not available.” A blank or unavailable metric is not a measured zero. Capture Instagram numbers each month: its insights cover any period within the past 90 days, so older months cannot be pulled later.6
| Field | This month | Previous comparable period | Note or next action |
|---|---|---|---|
| Platform, account, date range | Fill in | Fill in | Include capture date |
| Goal and primary metric | Fill in | Fill in | Keep the goal explicit |
| Posts published, by format | Fill in | Fill in | Explain a change in volume |
| Reach or unique audience | Fill in | Fill in | Preserve the native label |
| Impressions or views | Fill in | Fill in | Specify exactly which |
| Interactions, split by action | Fill in | Fill in | Keep saves and shares visible |
| Engagement rate and formula | Fill in | Fill in | Name numerator and denominator |
| New follows and unfollows | Fill in | Fill in | Add ending follower total |
| Profile visits or link visits | Fill in | Fill in | Name the destination |
| Video watch time | Fill in | Fill in | Include units and format |
| Best post for the goal | Post link | Post link | Describe what to test again |
| Next experiment | Fill in | Result of prior test | Change one meaningful variable |
Use platform-level unique audience totals where available. Adding every post's reach counts the same account again whenever it sees another post, so label that sum as post-level reach rather than a deduplicated monthly audience.
Turn the report into a content decision
Read totals and rates together. More impressions with a lower interaction rate can still mean more interactions overall. Fewer views with more relevant inquiries may serve your business goal better. The report should make both observations visible.
Choose a repeatable comparison: educational carousels against educational carousels, or short demonstrations against short demonstrations. Review the actual posts before explaining a change. Note differences in topic, offer, format, paid support, and the amount published.
Finish with one practical sentence: “Next month, test a clearer service invitation on portfolio posts and compare profile visits.” Put that experiment in your content calendar, then review its result using the same definition and capture timing. That gives your next report a question to answer.
FAQ
What is the difference between a metric and a KPI?
A metric is a measurement. A KPI is a measurement you choose to judge progress toward a specific goal, such as link visits for a post intended to send people to a resource.
Should a small account track every available number?
Start with the outcome you want, its main metric, and enough context to interpret it. Add detail when it helps you make a publishing decision.
Can I combine all platforms into one reach total?
Keep reach separate by platform. Each platform counts only its own audience, and the same person can appear on more than one network, so adding platform totals can count one person twice.
General information. Platform features, limits and benchmarks change: check the cited page before you rely on a number.
References
- LinkedIn. Content analytics for your LinkedIn Page. n.d. View source (accessed Nov 10, 2026).
- Instagram. About Instagram insights. n.d. View source (accessed Nov 10, 2026).
- Instagram. View insights on your Instagram reels. n.d. View source (accessed Nov 10, 2026).
- YouTube. Understand your YouTube content performance. n.d. View source (accessed Nov 10, 2026).
- Hootsuite. How to calculate engagement rate in 2026. 2026. View source (accessed Nov 10, 2026).
- Instagram. View account and content insights on Instagram. n.d. View source (accessed Nov 10, 2026).
- LinkedIn. View your creator analytics. n.d. View source (accessed Nov 10, 2026).
- TikTok. TikTok Studio. n.d. View source (accessed Nov 10, 2026).