

In short
- Keep personal post, audience, and profile analytics separate from company Page reports.
- Read impressions as displays and members reached as a distinct audience estimate.
- Check the report's date logic and export format before combining its numbers.
In this article
LinkedIn analytics separates your personal content, audience, and profile activity from a company Page's reports. Use your profile's Analytics section for personal results and the Page admin view for company results. Start by identifying which account and report you are reading before comparing numbers.12
Personal profile analytics or Page analytics?
For a personal profile, LinkedIn distinguishes individual-post analytics, combined content analytics, audience analytics, and profile analytics. Profile analytics includes profile visitors and search appearances; the detail available for profile visitors depends on membership and visitor settings. LinkedIn says all members have access to these analytics.1
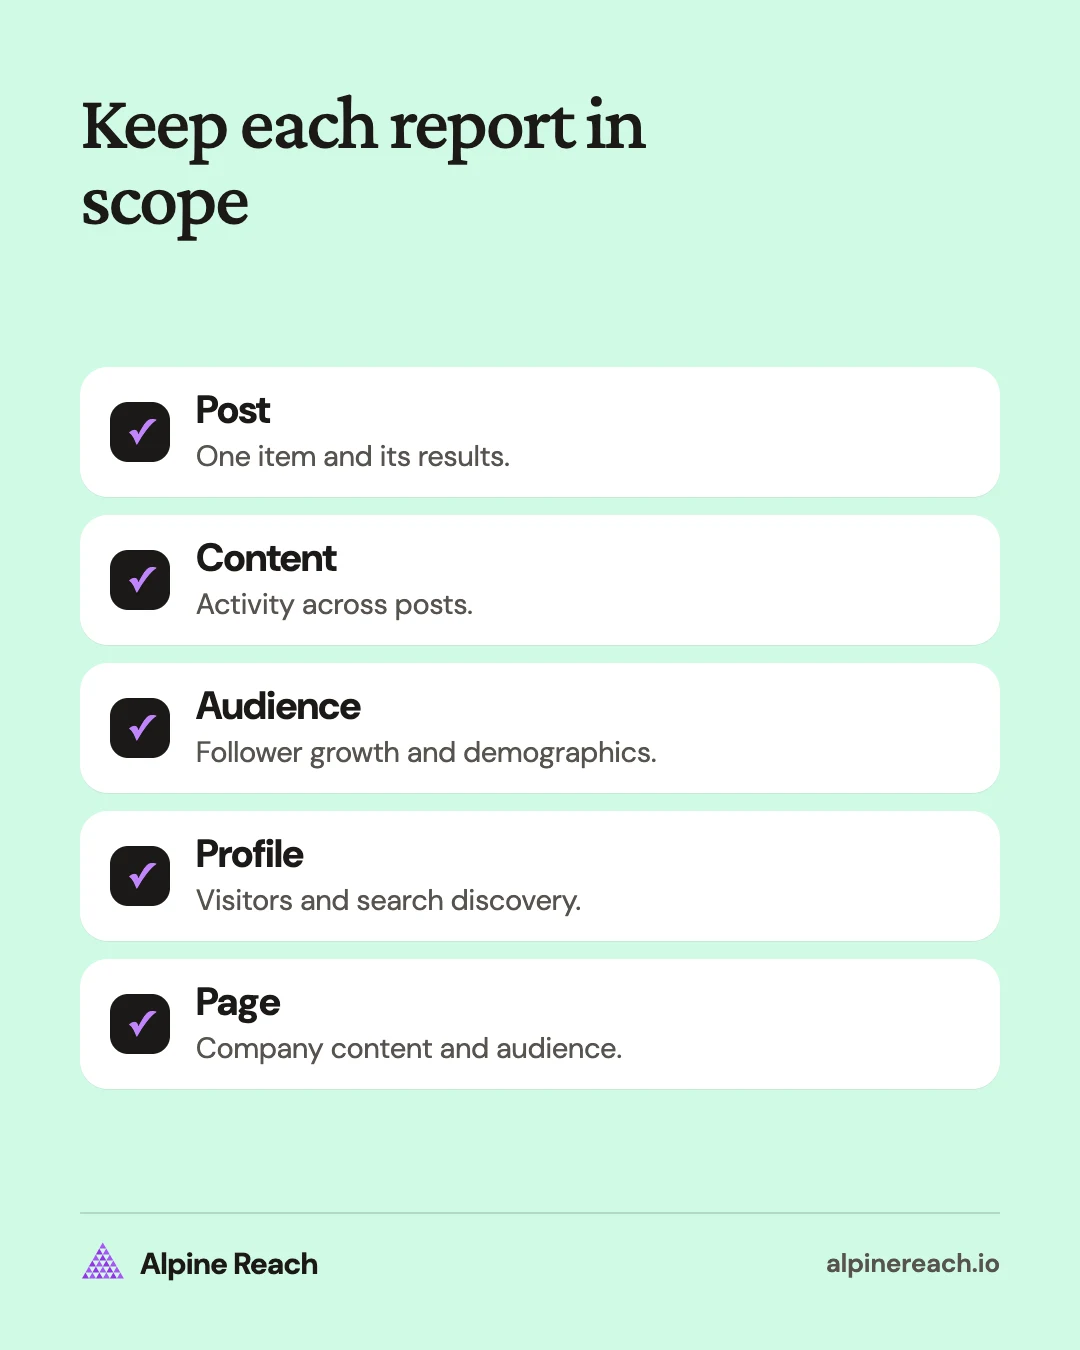
Treat those reports as separate views of your work:
| Report | Your question | What to record |
|---|---|---|
| Individual personal post | How did this post perform? | Exposure, responses, and any attributed next steps |
| Personal content analytics | What happened across my posts? | Period totals and the posts behind them |
| Personal audience analytics | Who is following me? | Growth and available follower demographics |
| Personal profile analytics | Are people finding and visiting me? | Profile views and search appearances |
| Page analytics | How is the company Page performing? | Content, visitors, followers, and Page visibility |
An employee's personal audience and a company's Page followers are different groups. Keep separate reports even when they share the same article or discuss the same product. Otherwise, you cannot tell which account produced the result you want to repeat.
The navigation and definitions below reflect LinkedIn's public English help pages checked on November 10, 2026. Some newer tables are being introduced gradually, so a documented option may not appear in every account yet.3
Where to find personal post and profile stats
On desktop, open Me, choose View Profile, scroll to Analytics, and select Show all. LinkedIn's current instructions then direct you to Content analytics or Audience analytics in the dashboard's left pane.3
For a practical review:
- Open Content analytics and choose your reporting dates.
- Switch between Impressions and Engagements to inspect the corresponding trend.
- Open the posts behind a change rather than explaining it from the total alone.
- Open Audience analytics separately to review new followers and available demographics.
- Return to profile analytics to inspect profile visitors and search appearances.
LinkedIn documents the content and audience controls separately. In the mobile app, its route starts with your profile photo, your profile, and Analytics, followed by the Overview selector for Content analytics or Audience analytics.3
For one post, open that post's analytics and use its own figures. LinkedIn's post reference lists discovery, profile activity, social engagement, link engagement, and viewer demographics, with additional fields depending on the content type.4
Keep the post URL in your notes. A row named “educational post” is hard to inspect later; a link lets you review the exact opening, topic, format, and invitation.
What the personal-profile metrics mean
Impressions count times a post was displayed. Members reached counts distinct members and Pages that saw it, excluding repeat views. LinkedIn describes these analytics as estimates.4 Your own views and engagements on a post are counted in its analytics.4
Social engagement includes reactions, comments, reposts, saves, and sends on LinkedIn. Personal post analytics also distinguishes profile viewers and followers gained from that post, rather than treating all profile growth as a result of the latest thing you published.4
For video posts, LinkedIn counts a video view each time the video was watched for two or more continuous seconds, including replays, and reports watch time and average watch time.4
Use the measures this way:
- Impressions: inspect how much distribution the post received.
- Members reached: inspect the distinct audience behind that distribution.
- Reactions and comments: examine the response, including what people actually said.
- Reposts and sends: compare content people passed along.
- Saves: compare material people kept.
- Post-attributed profile views and follows: examine the next steps associated with that post.
These are interpretation prompts, not proof of intent. A saved post is not a qualified inquiry, and a profile visit is not a purchase.
Profile views concern visits to your profile. Search appearances concern being found through LinkedIn search. Neither is the same as a post impression, and appearing in search does not establish a profile visit.1
For an account-wide monthly review, use audience analytics for follower trends. Avoid adding post-attributed follows and account-wide new followers together as if they were separate groups.
How content totals and post tables use dates
Combined post analytics supports date ranges from the past seven days up to the past 365 days. Its content-performance graph reports impressions or engagements received in the selected period and populates through yesterday to use complete days.5
This creates an important distinction in the newer Most recent posts performance table. LinkedIn says its date selector chooses posts by their creation dates, while their displayed metrics are lifetime totals. Those totals do not shrink to the selected date range.5
For example, imagine a post published last month that continues receiving views this month. Its new views can belong in this month's content-performance total. Its lifetime row also includes earlier views. Adding lifetime rows for posts published this month therefore will not necessarily reproduce this month's graph.
Label the question in your report:
- “Activity received during this month” for the period-based content graph.
- “Results so far for posts published this month” for a creation-date cohort using lifetime totals.
The second approach also requires a consistent capture age. A post published near month-end has had less time to accumulate responses than one published near the beginning. Compare posts at a similar age before using the table to decide which topic is stronger.
How to read company Page analytics
Open the company Page admin view, then Analytics. LinkedIn lists Content, Visitors, Followers, Page appearances, and other reports in this area. These are Page reports, separate from the member analytics on your personal profile.2
In Page content analytics, impressions measure displays, while members reached counts distinct members and Pages. Clicks can include clicks on content, the company name, or the logo. A Page click total therefore is not automatically a website-traffic total.6
The Page's native engagement rate is interactions divided by impressions, with clicks, reactions, comments, and shares included. Keep that definition beside the number when comparing it with your own manual calculation.6
The Followers report shows total followers since the Page was created and new followers over time. Changing the date range does not change the total, and inactive accounts are excluded from it.7
Use the engagement rate formula guide when you need to reproduce a rate. A personal-profile calculation using a different numerator should have its own label, even if it also divides by impressions.
Separate organic and sponsored results when evaluating unpaid posting. LinkedIn warns that boosted-post content analytics can differ from Campaign Manager because the reports cover different delivery scopes. It also says some Page metrics can take up to 48 hours to appear, with reactions and comments reflected in real time.6
For an early report, state the capture date and leave room for delayed data. Do not explain a just-published post's missing metric as poor performance.
How to export and build a monthly report
For personal content or audience analytics, LinkedIn documents an Export option for an XLSX file. Where you have the newer desktop post-performance table, it has a separate CSV export; LinkedIn says to use Load more before exporting if you want more than the five most recent posts.3
For a company Page, go to Analytics, choose Content, Visitors, Followers, or Competitors, click Export, choose a timeframe, then export the XLS file. Do not assume every Page report has the same export option.8
Export on a schedule, because LinkedIn keeps personal post data for limited windows. Its help page says members reached data is available for 400 days and demographic breakdowns for 180 days, while discovery and social engagement counts last 1,000 days for most content types and video analytics last 365 days.4
Save the original export and make your analysis in a copy. Use a filename that identifies the account, reporting period, report type, and capture date.
| Monthly field | Personal profile | Company Page |
|---|---|---|
| Publishing activity | Posts by format and topic | Posts by format and topic |
| Distribution | Period impressions and members reached | Organic and sponsored distribution separately |
| Response | Native engagements, with definition | Native engagement rate and its components |
| Audience | New followers and ending total | Follower growth in the Page report |
| Next step | Profile activity and available link metrics | Page visits and clearly labeled click metrics |
| Interpretation | Best posts for your goal | Best posts for the Page's goal |
| Next experiment | One change to test | One change to test |
Use the same reporting window and formula next month. Add a brief explanation of what changed in publishing volume, subject matter, or promotion. The social media metrics guide gives you a broader report template; the LinkedIn content strategy guide can help turn the finding into your next planned post.
FAQ
Do I need Premium to see LinkedIn analytics?
LinkedIn provides member analytics to all members. Some profile-viewer detail and other features depend on membership, privacy settings, or availability.
Why does an exported post table not match my monthly graph?
Check whether the graph counts activity during the month while the table selects posts by publication date and shows lifetime totals. Those are different reporting scopes.
Are company Page clicks the same as website visits?
No. Page content clicks can include content, company-name, or logo clicks. Keep that metric separate from a specifically identified external-link or website measure.
General information. Platform features, limits and benchmarks change: check the cited page before you rely on a number.
References
- LinkedIn. Analytics for LinkedIn members. n.d. View source (accessed Nov 10, 2026).
- LinkedIn. Access your LinkedIn Page analytics. n.d. View source (accessed Nov 10, 2026).
- LinkedIn. View your creator analytics. n.d. View source (accessed Nov 10, 2026).
- LinkedIn. Post analytics for your content. n.d. View source (accessed Nov 10, 2026).
- LinkedIn. Combined post analytics. n.d. View source (accessed Nov 10, 2026).
- LinkedIn. Content analytics for your LinkedIn Page. n.d. View source (accessed Nov 10, 2026).
- LinkedIn. Follower analytics for your LinkedIn Page. n.d. View source (accessed Nov 10, 2026).
- LinkedIn. Export your LinkedIn Page analytics report. n.d. View source (accessed Nov 10, 2026).