In short
- Sprout and Buffer both rank midweek highest, with Wednesday their strongest day; Later favors early mornings.
- Buffer’s daily timing table is a starting point drawn from its own sample.
- Instagram’s Total followers activity insights require at least 100 followers.
In this article
The best time to post on Instagram is a time your own audience responds to consistently, not a universal hour. As a starting point, the 2026 studies from Sprout Social and Buffer both favor midweek, with Wednesday their strongest day, and both found weaker results at the end of the week or on weekends.12 Later's data points to early mornings instead, because each study measures different accounts, periods, and outcomes.3 Use the sourced comparisons below to choose a starting window, then test it against your Instagram Insights.
What the published timing studies found
These are the pages available on November 10, 2026. Their publication dates do not necessarily describe when their data was collected. Engagement means actions such as likes, comments, saves, and shares; an engagement rate expresses those actions relative to a denominator such as followers.
| Publisher and page date | Sample and collection period | Published Instagram finding | Time-zone treatment |
|---|---|---|---|
| Sprout Social, March 31, 2026 | Nearly 2 billion engagements across roughly 307,000 profiles on several networks; November 27, 2025 to February 27, 2026 | Tuesday and Wednesday are strongest; Wednesday's main window is noon to 9 p.m. | Audience local time. 1 |
| Buffer, September 23, 2026 | 9.6 million Instagram posts; January 2024 to December 2025; median engagement rate | Thursday at 9 a.m., Wednesday at noon, and Wednesday at 6 p.m. lead | Local time. 2 |
| Hootsuite, July 14, 2026 | More than 1 million social posts with Critical Truth; the page calls this its 2025 analysis | Early mornings and early evenings, especially early in the week: Monday 3 to 9 p.m.; Tuesday 5 to 8 a.m. and 3 to 7 p.m.; Wednesday 5 p.m.; Thursday 4 to 5 p.m. | Localized across 118 countries. 4 |
| Later, April 21, 2026 | More than 6 million Instagram posts, including Reels; January to October 2024; engagement rates | Overall peak at 5 a.m.; a broader 3 to 6 a.m. window beats its average | Audience local time. 3 |
Notice the disagreement. Later favors early mornings and names Monday its best day, while Sprout's highlighted window is much later. Sprout ranks Saturday and Sunday lowest, while Buffer ranks Friday and Saturday lowest and calls Sunday evening its strongest weekend slot.312 These pages describe findings from their own samples, not a controlled test of your account. Do not combine their recommendations into a chart presented as Instagram's official timetable.
For example, a photographer serving nearby restaurants and a tutorial creator with an international audience have different readers. Even if they publish equally clear posts, the same posting window may serve them differently. That is a reason to test, not a reason to disregard every benchmark.
A daily starting table, with one consistent source
If you have no account history, you can use a single study's daily recommendations to avoid mixing incompatible methods. This table reproduces Buffer's leading daily slot, rather than constructing a new average from the other publishers. 2
| Day | Buffer's leading slot, local time |
|---|---|
| Monday | 7 p.m. |
| Tuesday | 7 p.m. |
| Wednesday | Noon |
| Thursday | 9 a.m. |
| Friday | 10 p.m. |
| Saturday | 9 p.m. |
| Sunday | 9 p.m. |
Late evening is not automatically too late. In Buffer's data, evening hours from 6 to 11 p.m. performed best on every weekday except Thursday, and 9 p.m. was its leading slot on Saturday and Sunday.2
Every row is a candidate to test, not a reason to add a daily post. Pick the rows that fit your existing Instagram posting frequency. A timing experiment is easier to interpret when you do not also change how often you publish.
Read “local time” carefully. Choose the audience location you are trying to serve and write down its time zone. Do not assume your own device location represents your followers. For an international audience, keep separate notes for the region each test is intended to reach.
Why the charts disagree
A large sample can still differ from the people you want to reach. Tool users, industries, account sizes, and country mixes affect who is represented. A study of established brand accounts does not automatically describe a new solo creator.
The studies also cover different periods. Later's page uses an older collection window than Sprout's, even though both page titles refer to 2026. Check the sample dates in the table before treating a headline year as a freshness claim.
Outcomes matter too. The time associated with more likes may not be the time associated with more useful inquiries. Buffer explicitly uses median engagement rate, whereas Sprout describes engagement windows. 21 A median is the middle result when observations are ordered, which helps describe a typical observation without making an unusually large result the average.
Format is another variable worth keeping stable in your own test. If you compare a tutorial Reel with a product photo, the topic and presentation changed along with the clock. You cannot confidently assign the difference to timing.
For Reels, Sprout reports the same windows as its overall finding, while Later's separate analysis of more than 975,000 Reels found 12 a.m. strongest.13
Find your audience's activity in Instagram Insights
Instagram's help page says public accounts can access Insights, and its Total followers section includes activity times once you have at least 100 followers. 5 Use that activity chart to choose a candidate window, then check actual post results.
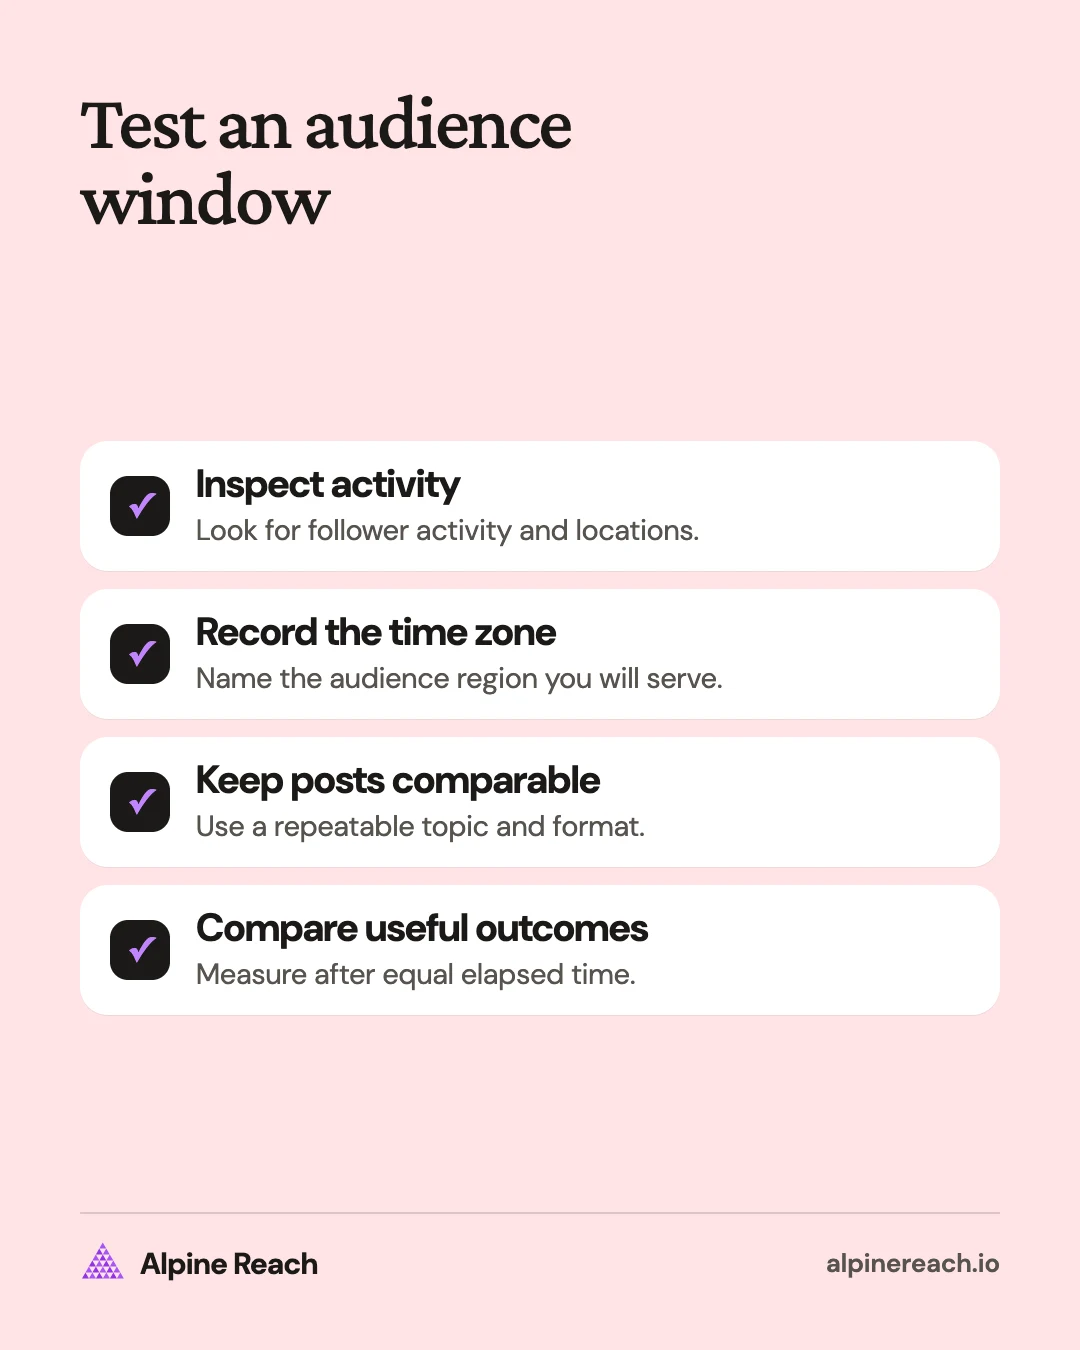
- Open your profile and dashboard. On a professional account, tap Professional dashboard; on a public personal account, tap Your dashboard. Follow the current menu labels if the layout differs.6
- Open the follower breakdown. Look for Total followers or the follower detail screen, then the most-active-times chart.
- Inspect the pattern. Check both days and hours, and note follower locations alongside activity.
- Record your intended time zone. If the chart does not identify it clearly, do not silently assume it matches your target audience.
- Choose a window you can repeat. Use it for comparable posts rather than moving every post to a different hour.
Instagram documents the follower chart and separate insights for individual posts and Reels. 5 Menu wording can change, so use the chart names as landmarks rather than expecting every account to have an identical screen.
If you cannot see follower activity, check whether you meet the follower threshold. You can still run a simple timing test using a published benchmark as your initial hypothesis. Avoid buying a tool solely to replace a chart before you have enough useful posts to compare.
Run a timing test you can interpret
Choose a repeatable series, such as a product-care tip or a short design demonstration. Alternate between a candidate activity window and a practical alternative. Keep the format, subject difficulty, and call to action similar enough that timing is a plausible difference.
Before publishing, decide what success means. For an educational post, it might be saves or substantive questions. For a service announcement, record inquiries about the offer. Check each post after the same amount of time so an older post does not have an unfair head start.
Record the date, time zone, format, topic, elapsed time before measurement, and chosen outcome. Review a group of comparable posts, not the single biggest result. If the pattern is inconsistent, keep the easier schedule and collect more evidence before making a stronger claim.
When your audience changes, revisit the test. A new service area, a change in language, or a different content series can make your old schedule less relevant. Timing should follow the audience you serve now.
For help choosing the actual subject, start with what to post on Instagram. A useful idea and a clear explanation give your timing experiment something worthwhile to measure.
FAQ
Is a late posting time automatically a bad choice?
No. A late slot can be a reasonable test if it fits the audience you serve. Compare similar posts and relevant outcomes before ruling it out.
Should I schedule in my time zone or my audience’s?
Plan for the people you intend to reach and record the time zone explicitly. If you serve several regions, keep a separate hypothesis for each rather than treating one clock as universal.
How do I test timing before follower activity is available?
Choose a practical window from a published study and compare it with an alternative using similar posts. Treat the results as provisional while you build account history.
General information. Platform features, limits and benchmarks change: check the cited page before you rely on a number.
References
- Sprout Social. Best times to post on Instagram in 2026 [Updated March 2026]. 2026. View source (accessed Nov 10, 2026).
- Buffer. Best Time to Post on Instagram in 2026: Data from 9.6 Million Posts. 2026. View source (accessed Nov 10, 2026).
- Later. Best time to post on Instagram in 2026 (based on 6M+ posts). 2026. View source (accessed Nov 10, 2026).
- Hootsuite. The best time to post on Instagram [2026 data]. 2026. View source (accessed Nov 10, 2026).
- Instagram Help Center. About Instagram insights. n.d. View source (accessed Nov 10, 2026).
- Instagram Help Center. View account and content insights on Instagram. n.d. View source (accessed Nov 10, 2026).