

In short
- Buffer highlights Wednesday at 4 p.m. in its September 2026 analysis.
- Sprout Social highlights midweek working-hour windows in its March 2026 analysis.
- LinkedIn provides individual-post analytics and a combined analytics export.
In this article
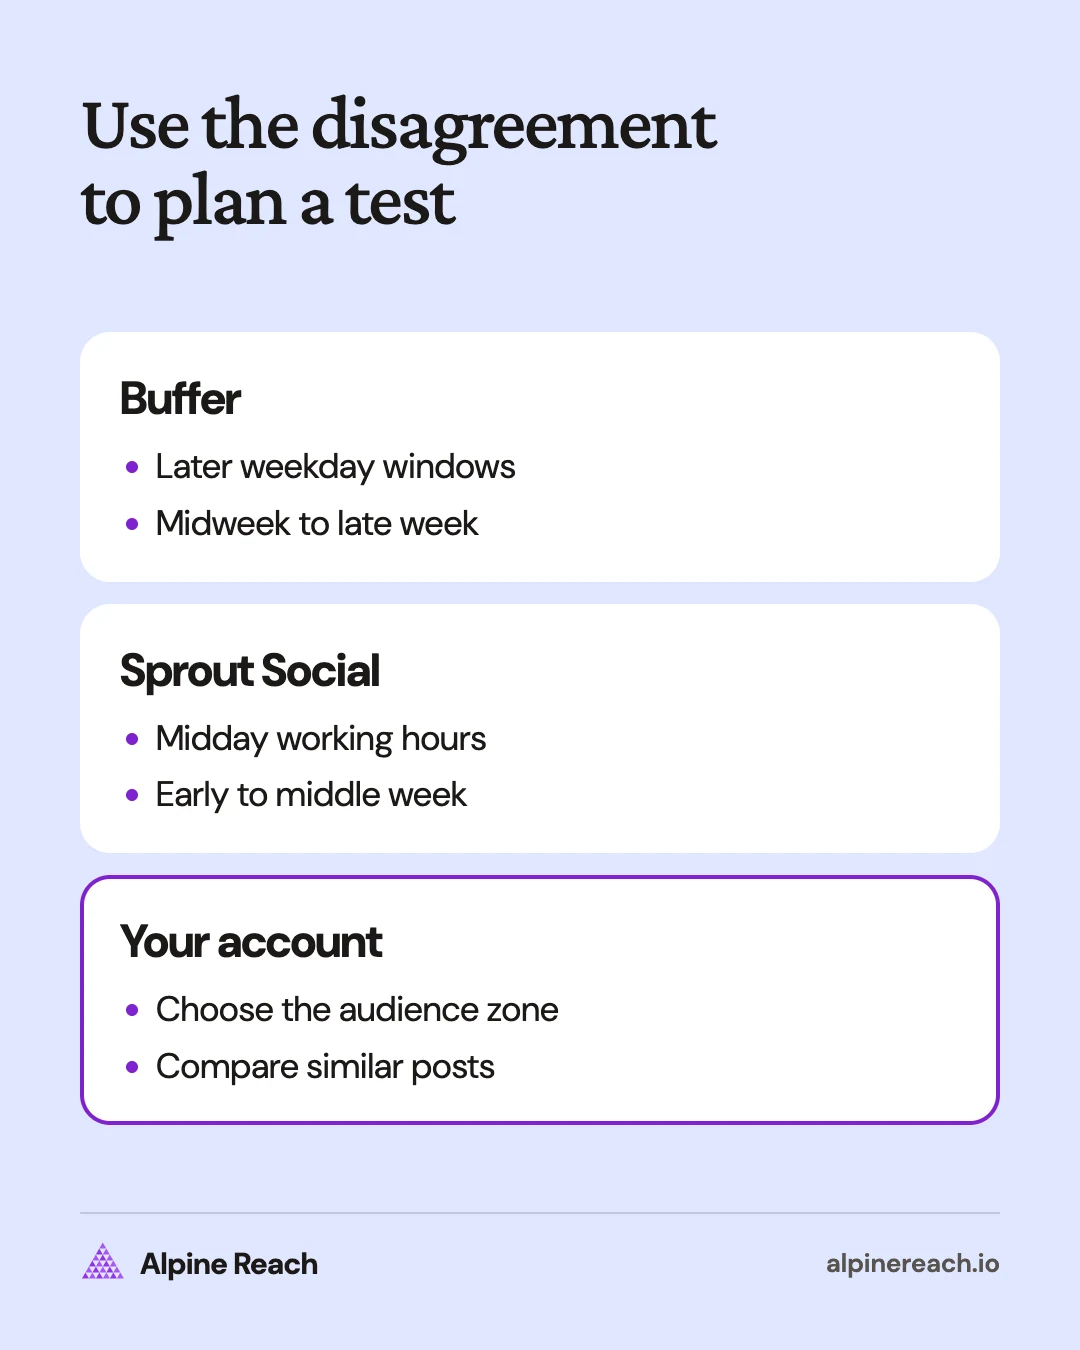
Start by testing Wednesday at 4 p.m. in your audience's time zone: that is Buffer's strongest slot in its September 2026 analysis.1 Also test a midday weekday slot, because Sprout Social's March 2026 analysis favors Tuesday through Thursday during core working hours.2 Treat these as candidates for your own test, since the studies disagree about the best day and hour.
What the published analyses actually found
Read the date, sample, and outcome before adopting a schedule. Buffer and Sprout Social both report engagement patterns, but their datasets are different and their findings should stay attached to their names.
| Analysis | Publication and sample | Main LinkedIn finding |
|---|---|---|
| Buffer | September 9, 2026; over 4.8 million LinkedIn posts sent through Buffer | Weekdays from 3 to 8 p.m.; Wednesday at 4 p.m. was strongest. Wednesday, Thursday, and Friday led by day. 1 |
| Sprout Social | March 31, 2026; nearly 2 billion engagements across 307,000 profiles on several social networks, collected November 27, 2025, through February 27, 2026 | Tuesday from 11 a.m. to 5 p.m.; Wednesday from 11 a.m. to 4 p.m.; strong midweek working-hour windows. 2 |
Sprout's sample totals cover several platforms, not LinkedIn alone. Do not describe that number as a LinkedIn post count. Buffer's cited article gives its LinkedIn post count but does not state the collection dates for that dataset.12
The practical disagreement is useful: Sprout highlights Tuesday, while Buffer puts Tuesday among its weaker days and favors later-week posting.12 You have competing hypotheses to test, rather than a single universal timetable. They also disagree on hours: Buffer's peak window runs from 3 to 8 p.m., while Sprout's FAQ describes late afternoons and evenings as low engagement periods.12
A large observational dataset describes the posts included in that analysis. It does not prove that changing only your publishing time will improve a post. Topic, audience, format, and the accounts included may differ too.
Which days and hours should you try?
Choose a starting schedule you can maintain while comparing similar posts. The table below selects a few published windows to show where the studies overlap and where they diverge.
The published windows are candidates, not expected results. You do not need to post in every slot. If your schedule only supports a small comparison, begin with a midweek midday post and a comparable late-afternoon post.
Both analyses describe weaker weekend engagement overall.12 That makes a weekday a reasonable starting point. A timely event, a weekend-focused professional audience, or your own account's history can still justify testing a weekend post.
Use your audience's time zone
Buffer says its times are normalized by local time zone; Sprout also labels its recommendations as local time for the target audience.12 Decide whose local time matters before scheduling.
If you write for US freelancers across regions, name your priority region in your test notes. A schedule based on where you live may answer a different question from a schedule based on where your intended readers live.
For a geographically mixed audience, choose an overlapping working window or rotate comparable posts between regions. Record the named time zone beside every scheduled time. Check the scheduler's displayed zone when seasonal clock changes occur.
Keep that choice stable during the comparison. Otherwise, you may think you are testing lunch against late afternoon while actually changing which audience is awake.
Find the evidence in LinkedIn analytics
For an individual post on desktop, go to Me, then Posts & Activity, select the content tab, and choose the impressions count or View analytics. LinkedIn's help page lists discovery, engagement, and viewer demographics among the available categories, depending on post type.3
Use these categories to check both response and audience fit. A post that attracts thoughtful questions from the people you wanted to reach can be useful even when another post records more views.
LinkedIn keeps post demographic breakdowns for 180 days, so record them while the test runs.3
LinkedIn defines impressions as estimated screen displays, rather than unique people. Its combined post analytics lets you compare impressions or engagements over a selected period and export an XLSX file.4
Keep a separate record of each post's publication time alongside the analytics. Use the export to help organize the comparison, then inspect the posts and their comments. Do not assume a portfolio trend is an hour-by-hour audience activity report.
For a detailed walkthrough of the metrics, use the LinkedIn analytics guide.
Run a fair posting-time comparison
Use this as a practical experiment, not a required platform cadence. Keep your normal volume manageable and spread the comparison across enough posts to see whether a pattern repeats.
LinkedIn's own Page posting guide gives the same advice: test posting at different times of the day to see what works for your audience.5
- Choose your outcome. Decide whether the test is about exposure, relevant comments, or visits to useful material. Record the outcome before looking for a winner.
- Choose contrasting windows. Pick a midday slot and a late-afternoon slot in the same target zone. Start on comparable weekdays.
- Keep content reasonably similar. Rotate practical tips through both windows. Avoid putting every announcement in one slot and every routine update in the other.
- Use the same measurement delay. Compare posts when each has had the same amount of time to collect responses. Record that delay in your notes.
- Record unusual conditions. Note holidays, events, paid promotion, and an unusually prominent reshare. Keep those posts visible but interpret them separately.
- Review the typical result. Compare the median, the middle result after sorting the observations, and read the comments. Check whether the preference survives removing the strongest post.
| Field to record | Why it matters |
|---|---|
| Post link and topic | Lets you inspect what was actually published |
| Format and goal | Helps avoid comparing unrelated types of content |
| Date, time, and named zone | Records the scheduling choice |
| Measurement delay | Keeps observation periods comparable |
| Impressions and relevant responses | Separates visibility from the response you wanted |
| Unusual conditions | Makes exceptions visible |
If the apparent winner depends on an unusual post, keep testing. If the results are similar, choose the window that fits your working routine and lets you respond to the discussion.
You may read about a LinkedIn “golden hour,” the period right after a post goes live. Buffer notes that LinkedIn has not confirmed an official 60 or 90 minute window, so treat it as a general idea, not a rule.1 In practice, publish when you can read and answer the first comments.
Decide when to change the schedule
For frequency, LinkedIn's writing guide suggests starting with one post per week and increasing until you find a cadence that suits you and your connections.6 Review timing when your intended audience changes, your content mix changes substantially, or repeated observations show a different pattern. A weak post by itself is not enough to diagnose a scheduling problem.
Before moving everything to a new hour, inspect the topic and opening with the LinkedIn post writing checklist. Keep a content strategy that records who the posts serve and what you want to learn from the response. Timing is a choice within that plan.
FAQ
What is the best time to post on LinkedIn for US readers?
Start with a published candidate in the local time of the US audience you prioritize. Compare midday and late-afternoon windows using similar posts.
Is Tuesday always the best day to post on LinkedIn?
The studies disagree. Sprout Social highlights Tuesday through Thursday, while Buffer favors Wednesday through Friday in its cited 2026 analysis.
Should I delete a post that starts slowly?
Keep the observation period consistent before judging the timing test. A single slow post cannot establish which publishing window suits your audience.
General information. Platform features, limits and benchmarks change: check the cited page before you rely on a number.
References
- Buffer. The Best Time to Post on LinkedIn in 2026: 4.8 Million Posts Analyzed. 2026. View source (accessed Nov 10, 2026).
- Sprout Social. Best times to post on LinkedIn in 2026 [Updated March 2026]. 2026. View source (accessed Nov 10, 2026).
- LinkedIn Help. View post analytics for your content. n.d. View source (accessed Nov 10, 2026).
- LinkedIn Help. Combined post analytics. n.d. View source (accessed Nov 10, 2026).
- LinkedIn. The ultimate guide to LinkedIn Page posting. n.d. View source (accessed Nov 10, 2026).
- LinkedIn. How to Write an Engaging Post in Your LinkedIn Feed. 2024. View source (accessed Nov 10, 2026).