

In short
- Quid uses followers, Buffer uses reach, and Socialinsider uses video views.
- Published results describe different samples and use different summaries.
- TikTok documents Analytics in TikTok Studio and More insights for individual posts.
In this article
A good engagement rate on TikTok compares well with your recent, similar videos and with a published benchmark using the same denominator, the number you divide by. There is no single cutoff: Quid's 2026 brand benchmark is a median of 2.01% by followers, while Buffer reports about 4.6% by reach for its 2025 baseline.12 Start by checking which measure produced your percentage.
What the current benchmark reports measure
Published reports answer different questions. Quid, which now publishes the Rival IQ report, uses followers; Buffer labels its TikTok measure as engagements divided by reach; Socialinsider uses video views.123 Here are the public figures checked as of November 2026.
| Publisher and report year | Reported result | Denominator and summary | Sample and measurement period |
|---|---|---|---|
| Quid / Rival IQ, 2026 | 2.01% | Followers; median performance | 150 companies selected per industry across 18 industries; organic and paid posts; exact collection dates not stated on the public page.1 |
| Buffer, 2026 | About 4.6% | Reach; median | Posts published through Buffer; report covers over 52 million posts across 10 platforms, not a TikTok-only sample count; baseline uses 2025 data, with latest data through December 3, 2025.2 |
| Socialinsider, 2026 | 3.90% | Views; average post rate | Publisher reports 40.7 million videos from 257,000 brand accounts; quarterly result labeled Q3 2026; organic posts; methodology states January 2025 to December 2026 (see caveat below).3 |
Keep the limitations attached. Buffer defines reach as unique accounts that saw a post and allows substitute denominators when reach is unavailable; its TikTok row does not itemize the actions counted.2 Socialinsider's methodology extends its collection window beyond this November 2026 check and says accounts above 100,000 followers were excluded, although its table includes a 100K to 1M tier; treat these figures as provisional publisher-reported context.3
These are descriptions of sampled accounts. A freelancer's tutorial account does not automatically have the same reference point as a brand in a broad industry report. Do not combine the percentages into a new average or turn the highest one into a universal target.
Which comparison fits your account?
Choose the report after identifying your denominator. Followers describe the account's audience size; views describe recorded video views; Buffer's reach definition describes distinct accounts exposed to the post.132 If your dashboard says unique viewers, check that definition before using a reach-based reference.
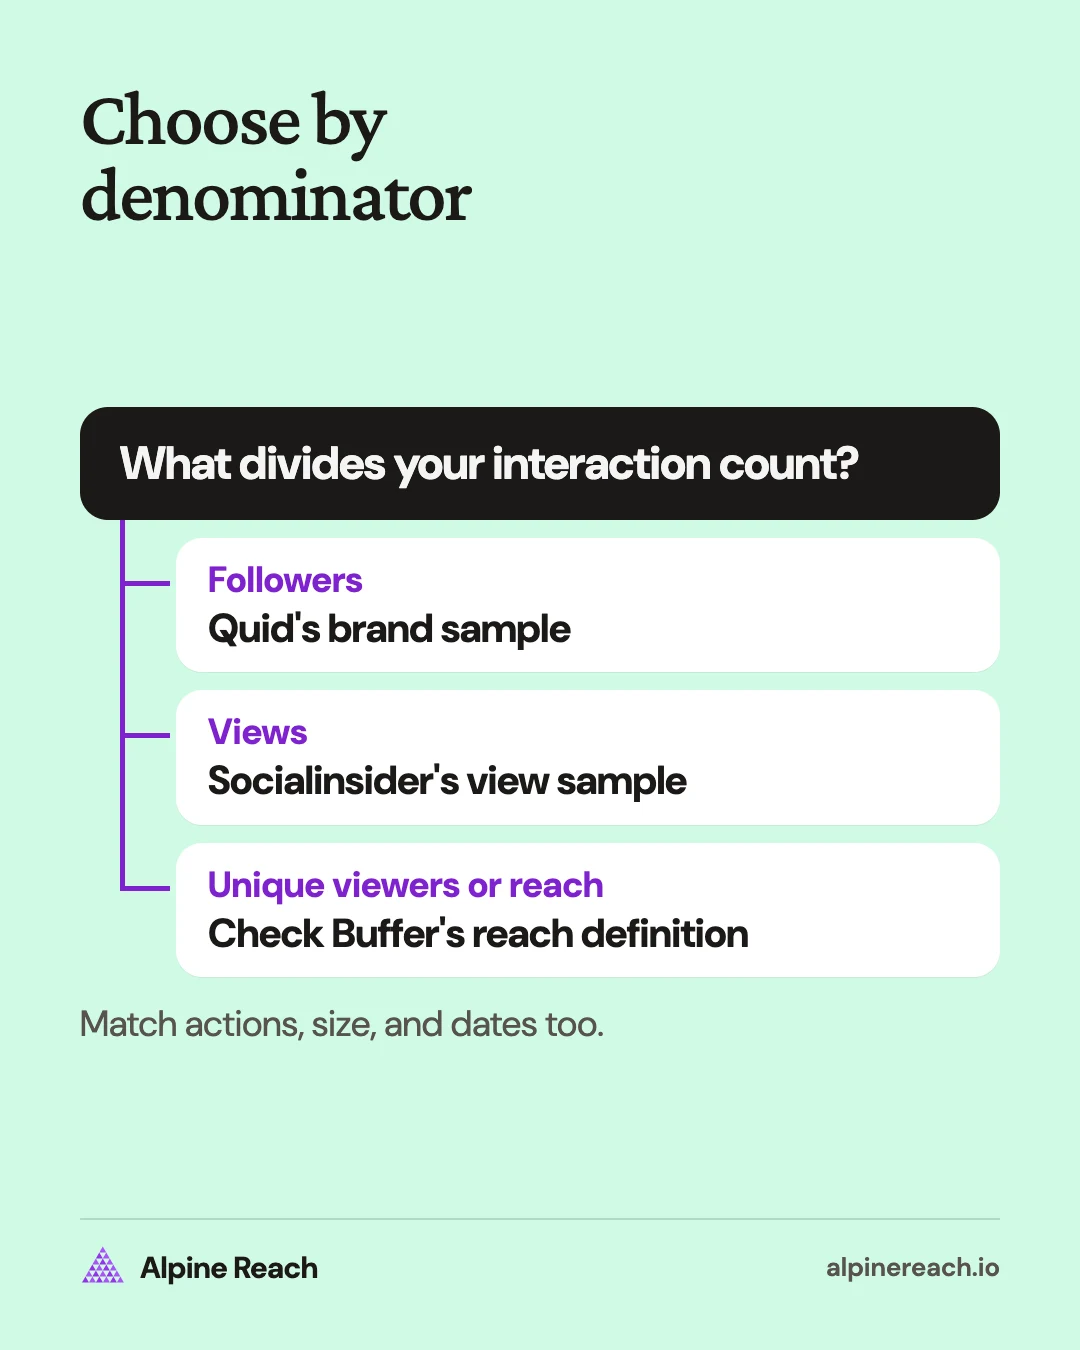
For one post, divide the interactions you include by followers, views, or a matching reach measure, then multiply by 100. Socialinsider includes likes, comments, shares, and saves; another report may define interactions differently.3 Use the engagement rate calculator to run your numbers and the formula guide for detailed calculations and averaging methods.
Before accepting an outside comparison, check:
- Actions: Does your numerator, the count on top, include the same interactions? A like-only percentage needs a different label.
- Denominator: Keep follower-based and exposure-based results in separate columns. Do not rename views as unique viewers.
- Summary: Compare a median with a median or an average with an average. A median is the middle result; an average adds the results and divides by their count.
- Timing: Match the reporting period where possible and give videos the same amount of time to collect responses.
- Distribution: Keep promoted videos separate when evaluating unpaid content.
For example, suppose your report shows a follower-based result above Quid's median. You can describe it as above that brand sample's median, with the method attached. That does not establish a rank among creators your size, or predict the response to your next video.
Does account size change the answer?
Account size belongs in the comparison even when you divide by views. Socialinsider's table labels its 2025 view-based averages as 4.40% for accounts with 1,000 to 5,000 followers and 3.75% for those with 50,000 to 100,000 followers.3 Those are publisher-reported size tiers, subject to the methodology caveat above.
Choose peers with a similar audience size, subject, and purpose. A local service account, an entertainment creator, and a product brand may want different responses from their videos. A shared follower range is only the start of a useful comparison.
If no report closely matches your account, say so in your reporting. Use the nearest published sample for context and put your own recent performance first. Avoid assigning yourself an influencer tier and borrowing a percentage from an article that never identifies its formula.
Do the same when comparing platforms. The Instagram benchmark guide explains that platform's studies separately. Keep each platform's method visible instead of using one percentage as a target everywhere.
Where to check your own inputs
As of November 2026, TikTok's Help Center gives this route: open Profile, tap Menu, select TikTok Studio, then tap Analytics within Posts. TikTok notes that availability varies and post data may be delayed.4
For an individual post, TikTok documents More insights at the bottom of the post on your profile. Its tools page also lists likes, shares, and views under post performance, and Content as the web analytics category for individual video metrics.5 Use that post-level view when recording a video's inputs.
On a Business Account, Web Business Suite offers Analytics, with Overview, Audience, and Video sections. Overview covers Reach, Engagement, Conversion, and Followers; the Analytics sections support a custom date range.6
Record the actions and denominator required by your chosen report, the post link, and the capture date. Copy the metric's actual label. If a needed count is unavailable, leave the comparison incomplete rather than entering zero or substituting a different measure. In particular, do not assume every version of analytics exposes the same unique-viewer or save field.
Start with your recent videos
Your most useful first question is: did this video earn a stronger response than your comparable recent work? An outside benchmark can add context after you have a baseline you can reproduce.
Build a small review sheet:
- Choose a recent reporting window. Include all eligible videos in that window. Avoid choosing only your favorites.
- Group comparable work. Separate tutorials from announcements if they serve different goals. Mark promoted posts and substantial changes in audience size.
- Capture posts at comparable ages. A newly published video and an older one have had different opportunities to collect responses.
- Keep one definition. Use the same actions, denominator, and summary method throughout each comparison.
- Read the posts behind the result. Note the subject, opening, useful demonstration, and responses you wanted.
For an example, suppose your comparable videos have a median view-based rate of 4%, and a new tutorial records 5% at the same age. It is above your recent middle result. If it reached a much smaller audience, though, check the actual comments and shares before deciding to repeat it.
Keep total actions beside the percentage. A small denominator can produce a high rate from very few responses. An unusually successful video can also change your average, so inspect it instead of letting one result define every future target.
If the baseline is too sparse to support a decision, keep collecting comparable observations. You can still assess whether the video answered its question clearly and whether the comments suggest a useful follow-up.
Turn the result into your next post
Use the comparison to choose a specific test. If a tutorial beat your baseline and attracted relevant questions, try another tutorial on a nearby problem. Keep the format recognizable and change the example or opening, so the next review has something concrete to compare.
If a video fell below your baseline, inspect the response before changing your whole plan. Was the subject useful to the audience you wanted? Did the demonstration answer the opening question? Did you ask for a response that made sense for the post?
Use the TikTok content ideas to turn that finding into a repeatable format. Check the posting-frequency guide if the test would change your workload, and connect the result to the goal in your social media strategy.
For a freelancer, a relevant service question may matter more than a larger number of casual reactions. Decide which outcome you want, keep measuring consistently, and use the benchmark as context for that decision.
FAQ
How do I check my engagement rate on TikTok?
Collect a video's interaction counts and the audience or exposure measure from its insights. Use the calculator linked in this article, label the denominator, and compare with a report using the same method.
Is 5% engagement good on TikTok?
The percentage needs a method and a comparison group. Check the denominator, actions counted, account size, and period, then compare with your own recent videos before judging it.
Why does my calculator result differ from my analytics?
Check the actions included, denominator, capture date, and summary method. If an input is missing, keep the result incomplete instead of replacing it with zero.
General information. Platform features, limits and benchmarks change: check the cited page before you rely on a number.
References
- Quid (Rival IQ). 2026 Social Media Industry Benchmark Report. 2026. View source (accessed Nov 12, 2026).
- Buffer. The State of Social Media Engagement in 2026: 52M+ Posts Analyzed. 2026. View source (accessed Nov 12, 2026).
- Socialinsider. 2026 TikTok Benchmarks. 2026. View source (accessed Nov 12, 2026).
- TikTok Help Center. How to use TikTok Analytics. n.d. View source (accessed Nov 12, 2026).
- TikTok Help Center. Tools for creators. n.d. View source (accessed Nov 12, 2026).
- TikTok for Business. About Web Business Suite. 2026. View source (accessed Nov 12, 2026).