

In short
- Start with the reader, the question, and the reporting period.
- Compare the previous month and the same month last year, with gaps labeled.
- Lead with three findings and one decision, then show the supporting numbers.
- Keep the report to one or two pages and finish with an assigned test.
In this article
- Who is the report for, and what question does it answer?
- Which period and comparison should you show?
- Put three findings and one decision at the top
- Choose the numbers by goal and keep the method visible
- Show top and bottom posts, then write a guess to test
- Where do you pull the platform numbers?
- What should you try next month, and how often should you send it?
- FAQ
- References
A social media analytics report should tell its reader what changed, what you think explains it, and what to do next. Start with the reader's question and reporting dates, put three findings and one decision at the top, then show the numbers and posts behind them. For a monthly review, aim for one or two pages with supporting data saved separately.
Who is the report for, and what question does it answer?
Name the reader and the decision before collecting numbers. A client might need to approve next month's work, a boss might need to choose where your time goes, and a solo creator might need to decide which topic to repeat.
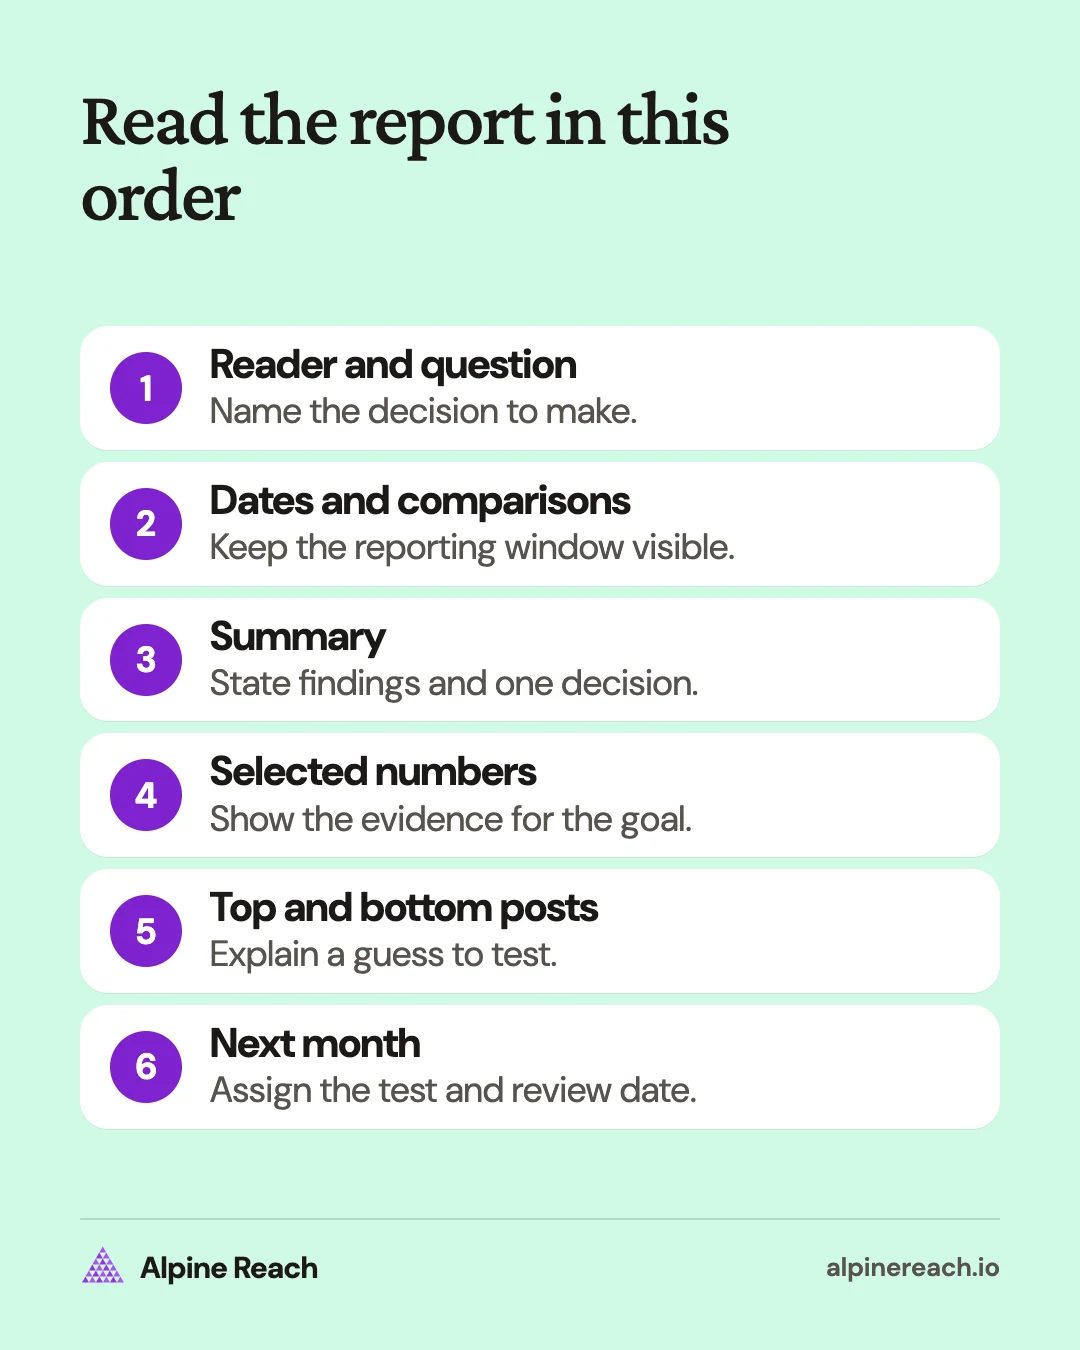
Write one question below the report title: "Did our social content bring relevant catering inquiries this month?" Use that question to choose what earns space. HubSpot's reporting guide similarly puts goals beside the summary, selected metrics, and recommendations.1
The worked example throughout is a made-up neighborhood bakery reporting to its owner. All its dates, counts, and results are example data. Its main question is about catering inquiries, so an increase in views alone will not answer it.
Which period and comparison should you show?
Put the platform, account, dates, capture date, and organic or paid scope in the header. For the bakery, use October 1 to 31, 2026, compared with September 1 to 30, 2026, and October 1 to 31, 2025. Record the same timezone for each period.
Use both comparisons for different questions:
- Previous month: what changed recently? Note differences in publishing volume, spending, offers, and days in the month.
- Same month last year: how does this month compare with a similar calendar period? Check whether promotions, holidays, and the business itself changed before calling a difference seasonal.
A single month gives you no baseline. Even a month-over-month increase can sit below last year's result, as the bakery's inquiries do below. Compare complete months; if you use a daily average to account for different month lengths, label it separately from the total.
Save a monthly snapshot rather than relying on being able to retrieve everything later. As of November 2026, Instagram's account and content date selector covers periods within the past 90 days.2 A year-over-year comparison therefore needs saved data. If last year's comparable number is unavailable, write "not available" and explain the gap.
Put three findings and one decision at the top
Use the free social media report template to build your report: copy it to your own Google Sheets in one click or download it as Excel (.xlsx) or CSV.
Write the summary after analyzing the data, then move it above the numbers. Each finding should identify a change relevant to the question. Keep a proposed explanation separate from what you actually counted.
The bakery's example summary could read:
- Website visits recorded from social rose from 100 to 120, an increase of 20% from September.
- Relevant catering inquiries recorded as coming from social rose from six to eight.
- Those eight inquiries remain below last October's ten, despite the monthly increase.
Decision: next month, test a catering demonstration with a clearer invitation to request a quote. Keep the publishing workload unchanged and review recorded inquiries at the next monthly check.
This gives the owner a decision to approve. Do not turn "inquiries rose" into "our posts caused more sales." Keep any attribution limits visible beside the result.
Choose the numbers by goal and keep the method visible
Choose a primary outcome and a few supporting measures. For awareness, consider views or reach; for engagement, inspect the relevant actions and a labeled rate; for traffic, inspect website visits; for leads, count relevant inquiries using a written qualification rule.
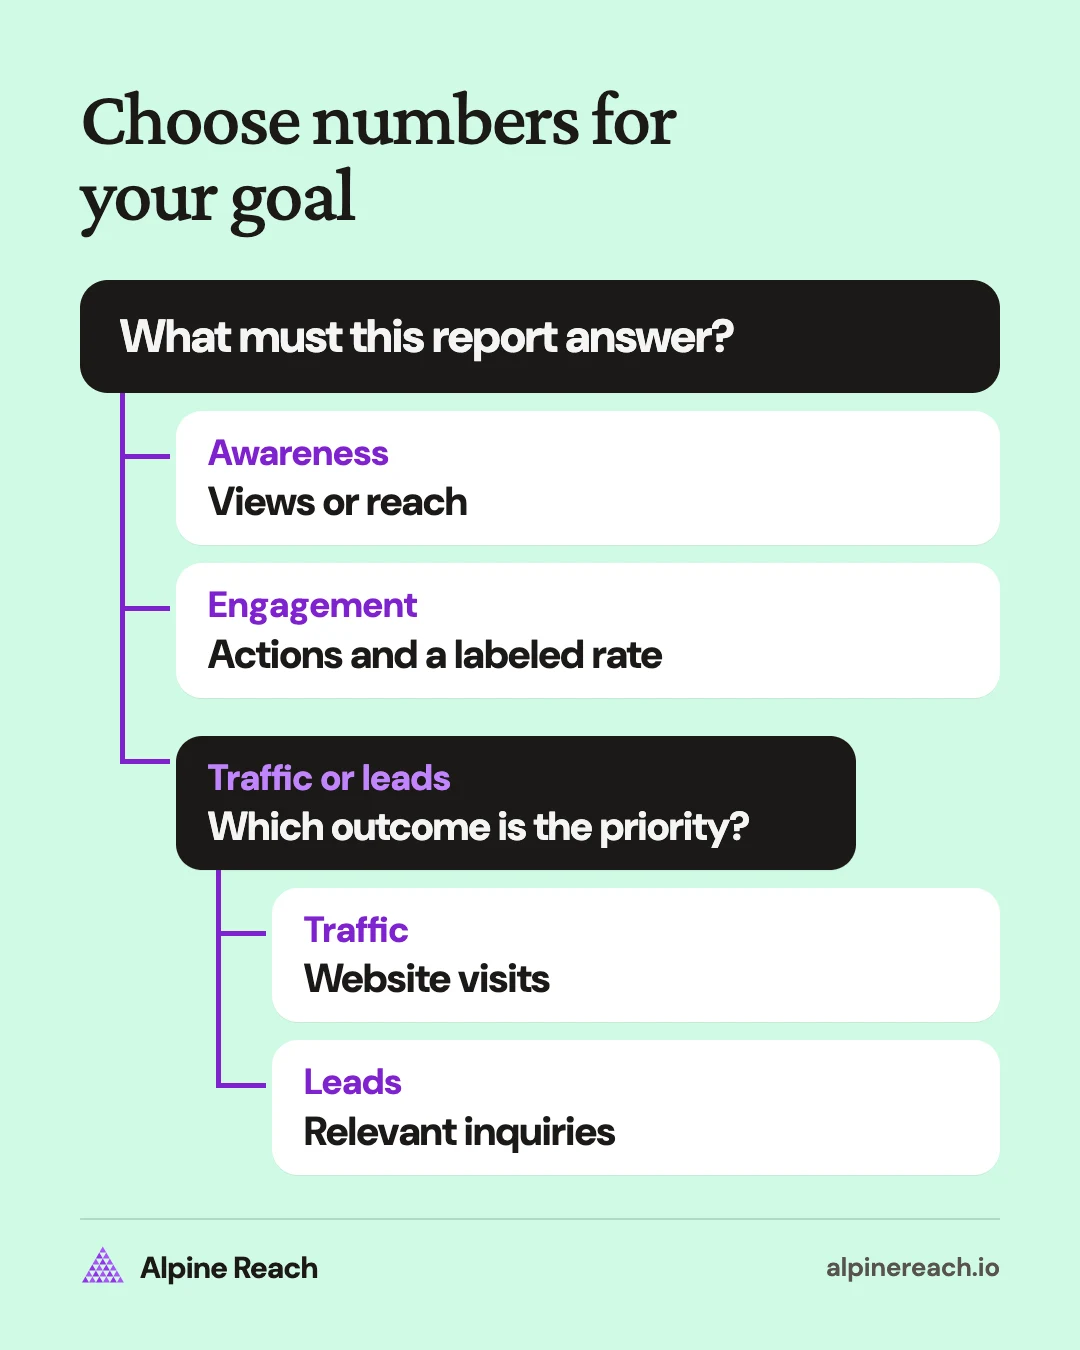
Use the social media metrics guide for definitions. Here, the job is to select numbers that answer the report's question, rather than reproduce the dashboard. Add publishing volume and paid spend as context when either changed.
For the bakery, count a relevant inquiry as a request for a catering quote. Exclude general comments and record how each inquiry's source was identified in the inquiry log. Keep visits and inquiries from website records separate from platform counts.
Example data: bakery monthly results, organic Instagram activity and recorded website outcomes. The bakery published ten posts in each comparison month. The website and inquiry log use the same source-labeling convention throughout.
| Selected measure | October 2026 | September 2026 | October 2025 |
|---|---|---|---|
| Instagram views | 24,000 | 20,000 | 22,000 |
| Website visits recorded from social | 120 | 100 | 100 |
| Relevant inquiries recorded from social | 8 | 6 | 10 |
Save a platform capture beside the example's views row, website records beside visits, and the inquiry log beside qualified requests. The table shows a monthly improvement and a year-over-year shortfall. It does not explain why either happened.
Keep website visits in their own row instead of substituting a platform click total.
Show engagement rate consistently
State the actions counted, denominator (the number you divide by), time window, and summary method beside the percentage. Use the engagement rate calculation guide for formulas, native-rate definitions, and ways to summarize several posts. Keep the method, label, and capture timing unchanged next month, and mark a missing input as unavailable.
Show top and bottom posts, then write a guess to test
Choose posts by the report's goal. Keep the post link, publication date, capture date, and the outcome you ranked them by. Compare similar posts at a similar age, with paid support recorded separately.
The bakery's example log cannot attribute inquiries to individual posts. Its post review therefore uses website visits from each post's labeled link as a supporting measure, captured seven days after publication:
- Top post: a catering preparation demonstration recorded 30 visits. Guess: showing the portions may have made the offer clearer. Test another demonstration with a different order size.
- Bottom post: a general catering announcement recorded four visits. Guess: the invitation may have been too vague. Test a version with the order size and quote-request step stated clearly.
These observations suggest experiments; they do not establish why someone clicked. Inspect the actual posts and the questions people asked before changing the whole content plan.
Keep this post comparison separate from the calendar-month table. Results captured at a fixed post age can include activity outside the reporting month. Do not add them up and present the sum as that month's website total.
Where do you pull the platform numbers?
Use the platforms' own reporting screens and preserve their labels. The routes and features below were checked against official help pages as of November 2026. Save the original data with the account, dates, report name, and capture date.
Instagram: use the Instagram Insights walkthrough to choose the account view or individual content and set the reporting dates.
LinkedIn: use the LinkedIn analytics guide to select a personal or company Page report and follow its export instructions.
TikTok: in the app, open Profile, Menu, then TikTok Studio.3 Under Analytics, View all includes individual-post insights; More insights is also available on a post.3 TikTok notes that tools vary across app and web experiences.3 For a Business Account, Web Business Suite's Analytics offers Overview, Audience, and Video.4 Overview and Audience support data downloads and custom date ranges.4
YouTube: open YouTube Studio's Insights area on desktop, then Advanced Mode or See more under a report.5 Use its date controls and Add comparison for period comparisons.5 Export current view downloads the selected report.5
For website traffic and leads, use your website records and inquiry log alongside the platform data. State the tracking rule and leave untraceable inquiries unassigned. Keep missing data visible instead of filling the gap with a platform click total.
What should you try next month, and how often should you send it?
Finish with a small test, its owner, the outcome to inspect, and a review date. For the bakery, assign the owner to approve the catering demonstration, keep the rest of the posting plan stable, and compare recorded quote requests in the next report.
For a solo creator or small team, start with a monthly report and a brief weekly data check. Agree a recurring send date after the month closes and include the capture date. Add a weekly update during a campaign only when someone needs a decision before the monthly review.
In a Reddit discussion about social media reporting, the original poster says manual reporting took several hours and asks about updating the spreadsheet periodically.6 A commenter describes switching to weekly updates.6 Treat those as individual experiences, not a standard completion time. Reuse the same outline and record how long your own data collection and analysis take.
If your client asks only for follower counts, include the ending total and change, then ask what decision that number should inform. Propose one additional outcome, such as relevant inquiries, and agree whether it belongs in next month's report.
Keep page one for the question, dates, summary, and selected numbers. Use page two for top and bottom posts, caveats, and the next test. Link to supporting exports instead of pasting every screenshot. Before sending, check that the reader can find the requested decision and the evidence behind it.
FAQ
What should I remove when my report is too long?
Move supporting exports and repeated screenshots out of the main report. Keep the question, comparisons, findings, selected numbers, post observations, and next test.
Can I report if last year's figures are missing?
Yes. Label that comparison as not available, explain the gap, and use the comparable periods you can document. Start saving monthly snapshots for later reports.
How should I handle a client who only asks about followers?
Show the ending count and its change, then establish what decision the client wants to make. Propose one additional outcome and agree whether to include it next month.
How much time should I allow for monthly reporting?
Record your own collection and analysis time rather than adopting a universal estimate. Reuse the outline, check data weekly, and save supporting records as you go.
General information. Platform features, limits and benchmarks change: check the cited page before you rely on a number.
References
- HubSpot. How to Create a Social Media Report in 7 Simple Steps [+ Free Templates]. 2025. View source (accessed Nov 14, 2026).
- Instagram. View account and content insights on Instagram. n.d. View source (accessed Nov 14, 2026).
- TikTok Help Center. Tools for creators. n.d. View source (accessed Nov 14, 2026).
- TikTok for Business. About Web Business Suite. 2026. View source (accessed Nov 14, 2026).
- YouTube Help. Learn how to use Advanced Mode for analytics reports. n.d. View source (accessed Nov 14, 2026).
- Reddit, r/SocialMediaManagers. How do you handle reporting social media analytics? n.d. View source (accessed Nov 14, 2026).